In April, Huntsville’ Planning Department began hosting Public Input Meetings and surveys for Vision Zero, an international effort to completely eliminate traffic deaths.
Our intrepid planners recently published the Huntsville Vision Zero Plan Preliminary Findings Report and presented extra analysis and findings to the 25-member Huntsville Vision Zero Task Force at the second Virtual Task Force Meeting. It’s a great read. But if you’re short on time, I’ve summarized what I think are the most interesting parts below.
Huntsville’s Vision Zero project has two main goals:
1. Find out which Huntsville roadways are the most dangerous
2. Identify the highest-ROI changes Huntsville City can make to improve transportation safety
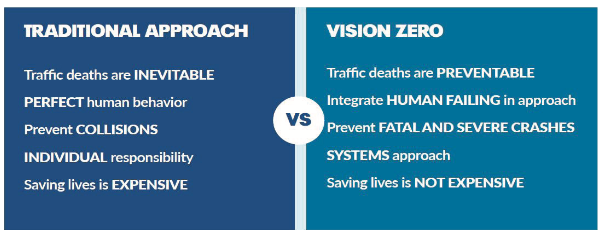
You should definitely read the report. But if you’re short on time, I’ve summarized the parts I found especially interesting below.
Read on to learn:
- How dangerous Huntsville’s roads are and the trendlines for traffic safety
- Who is most at risk for serious injury or death on Huntsville’s roads
- Where Huntsville roads pose the most danger
- Which potential solutions the report calls out
- What’s next in the Huntsville Vision Zero project process
Huntsville transportation safety stats
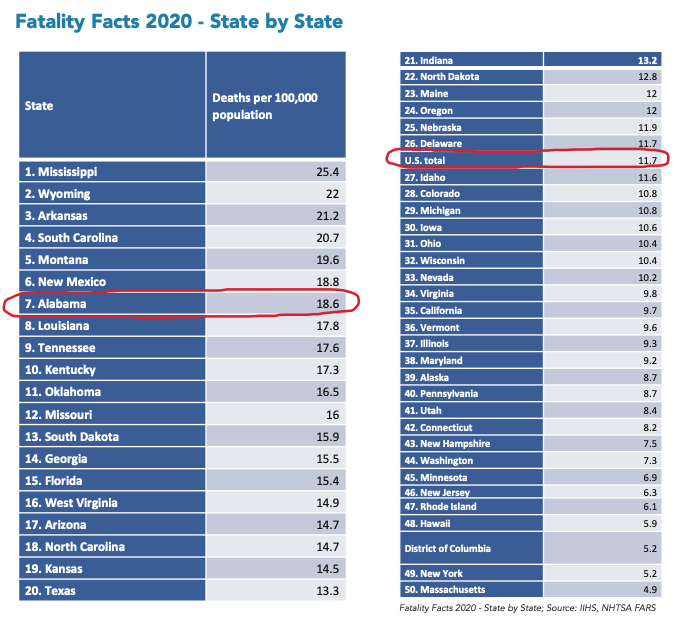
State rankings are often unkind to Alabama. It may not shock you to learn that traffic safety is no exception. Alabama has the seventh-highest rate of traffic deaths in the country.
By contrast, Huntsville usually rocks city rankings. But for the highest rate of traffic deaths in 2020, Huntsville ranked 43rd out of 172 US cities with 150,000 or more residents. Our pedestrian fatality rate put us in 35th place.
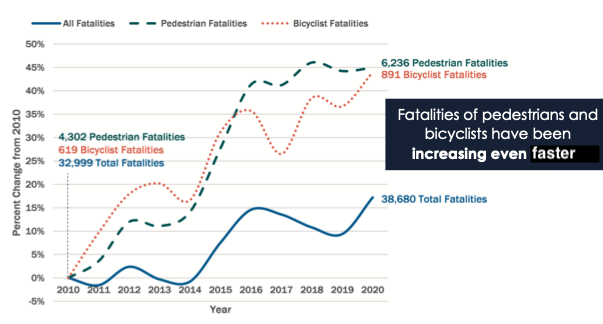
Between 2015 and 2020, Huntsville’s pedestrian fatality rate almost doubled. And our traffic fatality rate more than doubled.
On average, every year 23 people die in a traffic crash in Huntsville.
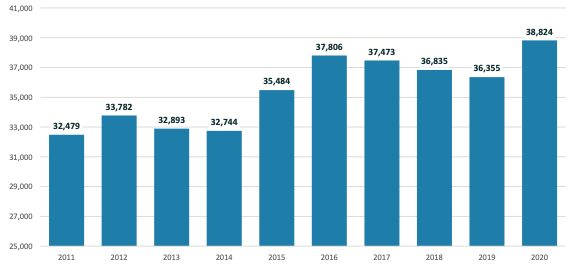
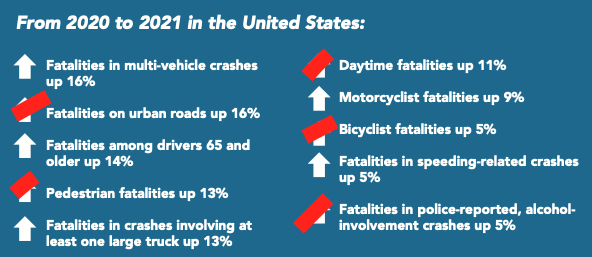
Total US traffic fatalities 2011 – 2020
Who dies in Huntsville crashes
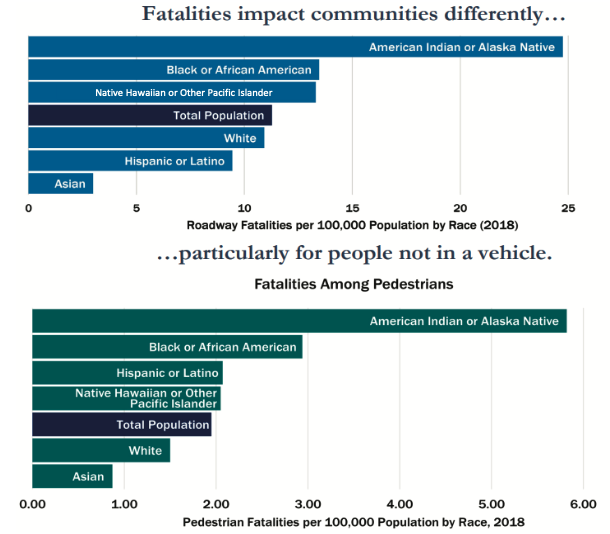
Traffic deaths are also a matter of equity.
Non-white people make up the vast majority of roadway deaths. This is especially true when looking at pedestrians who die along roadways. In Huntsville, People of Color are 33% more likely than white people to be involved in a pedestrian traffic death.
Most dangerous parts of Huntsville for transportation
Over many meetings, city planners presented a large-scale aerial map of Huntsville and invited community members to place dots on the map where they feel least safe traveling.
A different color represented each mode of travel.
Results:
- Memorial Parkway
- University Drive
- I-565
- Governors Drive
- Sparkman Drive
- Mastin Lake Road
- Oakwood Avenue
- Jordan Lane
- Research Park Boulevard
- Pulaski Pike
- Meridian Street
- Holmes Avenue
- Bob Wallace Avenue
- Whitesburg Drive
The City also created a High Injury Network (HIN) map based on which one-mile corridors had the greatest frequency and severity of crashes between 2017 and 2022.
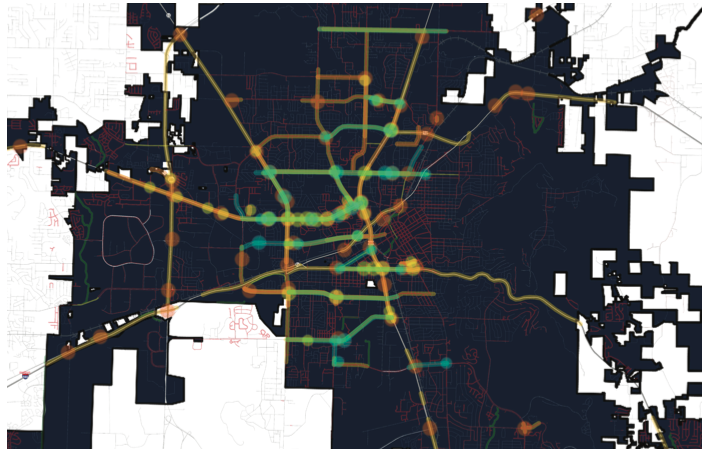
This map tells us a few things about preventing traffic deaths.
The deadliest stretches of roadway are:
1. Located in school zones and near hospitals
2. Not built to accommodate mass transit, bicycles, and/or pedestrians
3. State-owned rather than local
4. Located in disadvantaged and vulnerable communities
5. Given speed limits of 40 mph or higher
- Across the city, 80.2% of all Fatalities & Serious Injuries Crashes occurred on state-owned roadways versus 19.8% on local roadways.
- Fully 98.4% of the deadliest stretches are located in Disadvantaged Communities and/or Vulnerable Areas of Concern.
- Nearly all of the HIN (98.8%) is located on roadways with speed limits of 40 mph or higher.
Potential fixes
Two big contributors to crashes in Huntsville: dangerous behaviors and street design.
According to police, “improper crossing” was far-and-away the most common dangerous behavior associated with a pedestrian serious injury or fatality. Seems to indicate a need for more and better crosswalks.
The report called out comments from participants that included requests for:
- Pedestrian infrastructure connecting bus stops to rider destinations
- More mass transit
- Safety measures for multimodal transport to and from schools in north and west Huntsville
- More walkability and protected bicycle lanes throughout the city
- Better bicycle amenities at greenways and schools
- A safe way for bicycle riders and pedestrians to travel Memorial Parkway, Governors Drive and Holmes Avenue
- A safe way for people with disabilities to get to and from Huntsville Hospital
- Pedestrian crossing lights that serve elderly and disabled people living near Governor’s Drive
The process
Every summer, Planning Department heads gather with the Mayor to suggest which Complete Street projects to add to the City’s Capital Improvement Plan (CIP) and how to prioritize them. (The Complete Streets Workshop?) Then the Planning Department seeks grant funding to carry out prioritized Complete Streets projects.
The Planning Department designs all bicycle and pedestrian facilities in accordance with the Best Practices and standards from the following:
- National Association of City Transportation Officials (NACTO)
- Federal Highway Administration (FHWA)
- Institute of Transportation Engineers (ITE)
- Americans with Disabilities Act (ADA)
- Public Right-of-Way Accessibility Guidelines (PROWAG)
- American Society of Landscape Architects (ASLA)
- American Association of State Highway and Transportation Officials (AASHTO)
- Manual on Uniform Traffic Control Devices (MUTCD)
Huntsville Planning, Engineering, Traffic Engineering, Public Works, GIS, and Public Safety, and other departments conduct regular internal reviews of Complete Streets projects.
At the 2016 Complete Streets Workshop, the city chose Holmes Avenue and Clinton Avenue for Complete Streets pilot projects and committed funds in the city’s capital plan for both projects. Both roads were wider than their capacity demand and are alternatives to major thoroughfares I-565 and US-72.
In accordance with the Complete Streets policy, the City will measure the Holmes Avenue Complete Streets Corridor Project success using the following metrics:
- User Data: Bicycle, pedestrian, transit and traffic counts
- Infrastructure Data: Total miles of pedestrian accommodation built / dedicated by width and type; Total miles of bike lanes (standard, buffered and protected), bike routes, and shared-use pathways; Percentage of transit stops accessible via sidewalks and bicycle facilities; Number of transit accessibility improvements built; Number of traffic calming facilities built / installed; Number of crosswalks built or improved; Number of traffic control signs/signals installed/upgraded; Total dollar amount spent on Complete Streets improvements;
- Commute Mode Share Data: Transit ridership rates; Shift in mode share; Rate of children walking or bicycling to school; Change in Vehicle Miles Traveled
- Safety Data: Rate of crashes, injuries, and fatalities by mode;
- Property and Economic Development Data: Retail sales in walkable areas; Vacancies; Sale price; Property value; Building permits;
- Environmental and Public Health Data: Number of street trees planted; Air quality data;
- ADA measures: Number of compliant businesses; Percentage of intersections with ADA accessible curb ramps; Number of ADA accommodations built / installed; • Public opinion surveys;
- Number of exceptions approved.
Twice a year someone delivers interim reports to the Planning Commission and City Council, and publishes them as part of the MPO’s Transportation Quarterly Review (TQR). Planning also uses Citizens Advisory Groups to measure project performance.
- Criteria for potential Complete Streets infrastructure:
- Low to moderate traffic. Current daily traffic counts show there won’t be a huge disruption during construction of new infrastructure.
- Excess capacity. Corridors that are “too wide” for their current daily traffic counts, so these corridors can afford to go on a “road diet.”
- Destinations along a corridor. A Complete Street should be one that has places for pedestrians, cyclists and transit riders to go.
In 2019, Smart Growth America recognized the City of Huntsville’s Complete Streets Policy as one of the 2018 Top Ten best policies in the country. Smart Growth America added a new criterion in 2019 that included a new category for measuring equity in planning.
The City recently implemented its first Complete Street project, the Spragins Street Cycle Track. It’s also the “First Protected Bike Lane in the State.” It uses advanced ITS technology to detect oncoming cyclists and trigger traffic signals to give cyclists the right-of-way. The City is actively seeking funding for additional Complete Streets projects.
Huntsville will prioritize projects based on:
- HIN or Hot Spot located in Vulnerable Areas of Concern (VAC)
- Ped HIN
- Bike HIN
- HIN’s in relation to:
- Schools
- Transit
- Hospitals
- Senior Centers
- ADA High-Need Areas
At some point, the City will develop a Vision Zero Action Plan and then begin to implement it. They’ll then continue the VZ planning process as additional safety needs and issues arise in order to reflect the community’s changing dynamics. Planning will collect crash data annually and use it to benchmark progress. The Task Force will set crash rate reduction targets and a timeline for hitting them.
Planning will also coordinate and consult with existing safety studies, plans, and policies.
Existing plans include:
- Memorial Parkway Bicycle & Pedestrian Safety Study (adopted January 2022)
- Downtown Active Transportation Connectivity Action Plan (adopted January 2023)
- Meridian Street Corridor Redevelopment Plan (adopted June 2023)
- City-wide Complete Streets Policy (adopted 2016)
- Holmes Avenue Complete Streets Corridor Project
- Pedestrian Access and Redevelopment Corridor (PARC) – pursuing additional funding
- Huntsville Area MPO Bikeway Plan 2019
- Huntsville Area MPO Bikeway Plan Update (beginning Fall 2023)
- Sidewalk Improvement Program (ongoing)
- Intersection Improvement Program (ongoing)
- Huntsville Transit Study (adopted 2019 and currently being updated)
- Alternative Modes Review 2022
- Huntsville Area MPO ADA Transition Plan 2021
- Mill Creek Choice Neighborhood Plan 2022
- Huntsville Area MPO Long-Range Transportation Plan (LRTP)
Outstanding questions
What are all the steps in Huntsville’s Vision Zero project, what’s the timeline, and which step are we on now?
As stated earlier, on average 262 people die or are severely injured in a traffic crash in Huntsville each year while driving, 34 while walking, and 6 while biking. It would be interesting to know how dangerous driving vs walking vs biking are by comparing fatalities/serious injuries to the number of times per week the average Huntsvillian drives, walks, and/or bikes.